
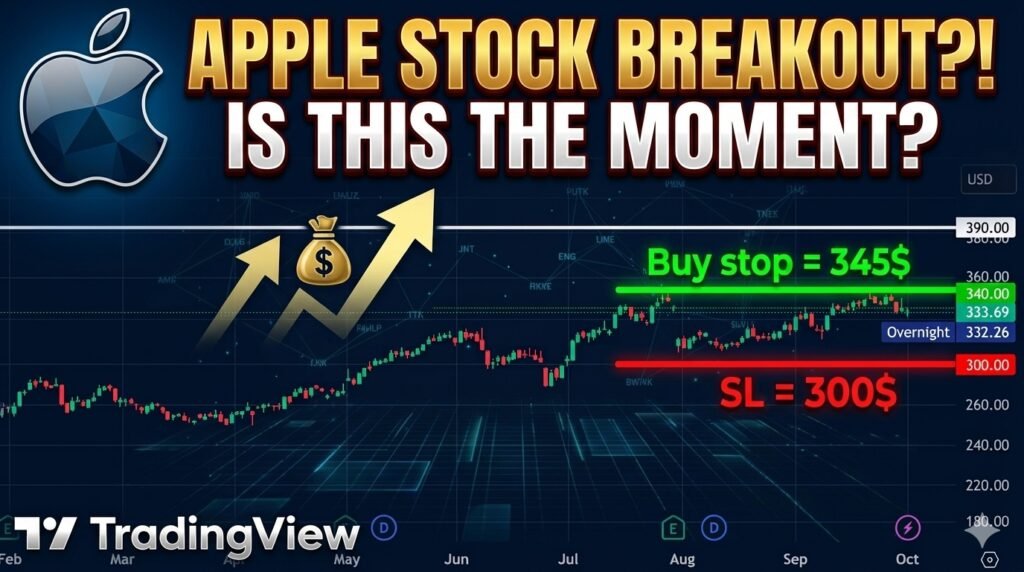

Apple Inc. (NASDAQ: AAPL) remains one of the most closely watched companies on Wall Street. Whether you are a day trader looking for quick scalps, a swing trader aiming for multi-week gains, or a long-term investor looking for an optimal entry point, tracking Apple’s key technical levels is essential.
In this comprehensive technical analysis, we break down Apple’s current price action, identify the critical breakout zones, and establish concrete price targets to help you optimize your trading strategy.
The Current Market Context: Apple’s Bullish Momentum
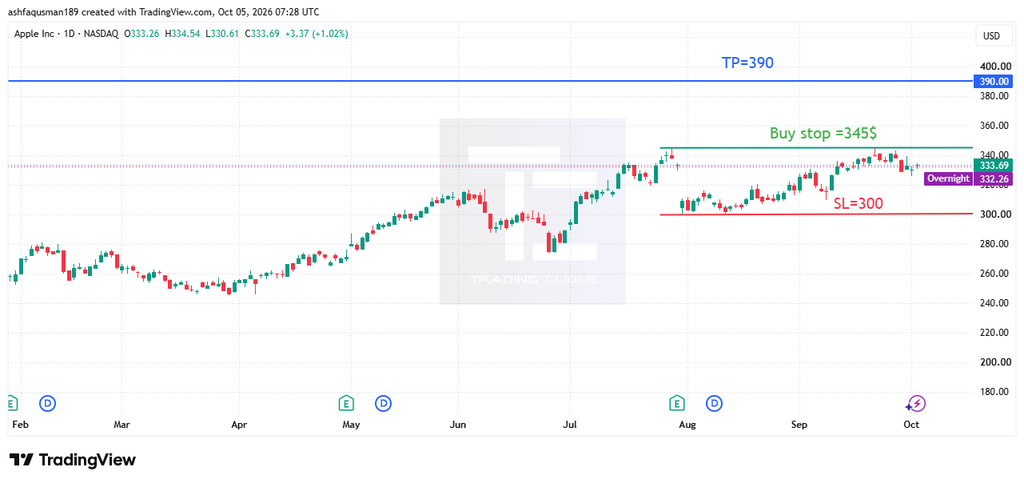
When evaluating any stock, the first step is determining the macro trend. Looking at the daily time frame, Apple stock is firmly locked in a bullish trend (0:23). The stock continues to print higher highs and higher lows, signaling that buyers remain firmly in control of the price action (0:23).In recent pre-market trading sessions, AAPL has been hovering around the $333.39 mark (0:32). This consolidation below historical highs suggests that the market is building up energy for its next major directional move. For tactical traders, this consolidation period is the perfect time to map out risk-to-reward parameters.
.
The Trading Strategy: Entry Points and Breakout Levels
Trading successfully isn’t just about buying a good company; it is about buying at the right price. Entering a trade blindly during a consolidation phase can tie up your capital or expose you to unnecessary drawdowns.
The Buy Trigger ($345): According to the technical charts, the optimal price level to initiate a fresh long position is at $345 (0:48). This level serves as a major line of resistance. A clean break and daily close above $345 confirms that the bullish momentum has resumed, clearing the path for a sustained rally.
Managing Risk: Stop-Loss and Profit Targets
A trading plan is completely incomplete without a strict risk management framework. Capital preservation should always be your number one priority when trading volatile large-cap tech stocks.
The Profit Target: $390
Once the stock successfully clears the $345 resistance zone, technical indicators point toward an upside profit target of $390 (0:59). This target offers an excellent risk-to-reward ratio for swing traders looking to capture a significant percentage move in the equity.
The Stop-Loss (SL): $300
To mitigate downside risk and protect your trading account from market reversals, a hard stop-loss must be placed at $300 (0:59). The $300 psychological level serves as a rock-solid floor of support. If Apple drops below this mark, the immediate bullish thesis is invalidated, and it is time to exit the trade to minimize further losses (0:59).
Final Thoughts for Traders
Apple’s daily chart shows clear signs of strength (0:23). However, discipline is the defining characteristic of a profitable trader. Instead of chasing the stock at its current pre-market levels, the highest-probability setup involves waiting for the market to prove itself by crossing the $345 threshold (0:48).
Keep your charts clean, watch the daily closes, and always respect your stop-loss parameters to keep yourself safe out there in the markets (0:59).
Disclaimer: This article is strictly for informational and educational purposes only and does not constitute financial, legal, or investment advice. Trading equities involves a high degree of risk, and you can lose money. Always execute your own due diligence or consult a licensed professional before putting capital to work.
